Overview: The Business Problem
In the Software-as-a-Service (SaaS) industry, free trials are the primary acquisition vehicle. But how much is a free trial actually worth?
This project tackles that exact question by utilizing SQL to transform raw transactional database tables into a cohesive business intelligence narrative. By analyzing user behavior across 30,239 trials and 6 world regions, the goal is to evaluate actual business performance, measure user commitment speed, and ultimately calculate a precise financial dollar value for an average trial sign-up.
Understanding the mechanics of conversion rather than just the final revenue number allows marketing teams to optimize their Customer Acquisition Cost (CAC) and better allocate regional budgets.
1. Defining the Core Metrics
To build a complete analytics picture, it is not enough to just look at gross revenue. We defined essential metrics that complete the fundamental loop of subscription health:
- Start-to-Conversion Window: Measuring the percentage of users who convert to a paid subscription exactly when their 1-month trial ends.
- Velocity vs. Cohort Reporting:
- Velocity Metrics track events by the absolute month they occurred (good for basic cash flow).
- Cohort Metrics track actions relative to the start month of the user’s trial (vital for true retention measurement).
- Price Elasticity: Quantifying how sensitive a region’s conversion rate is to changes in the underlying subscription price.
30 Days Median Conversion Time
32.1% Jan ’22 Cohort Conversion
$65.57 Jan ’22 Value Per Trial
2. Velocity vs. Cohort Reporting
Using raw velocity (comparing this month’s revenue to this month’s trials) often yields disjointed insights because users who start a trial today won’t actually pay until next month.
By analyzing the data cohesively using SQL to group users into monthly cohorts, we observed the true underlying lifetime value of a sign-up.
The Conversion Trend
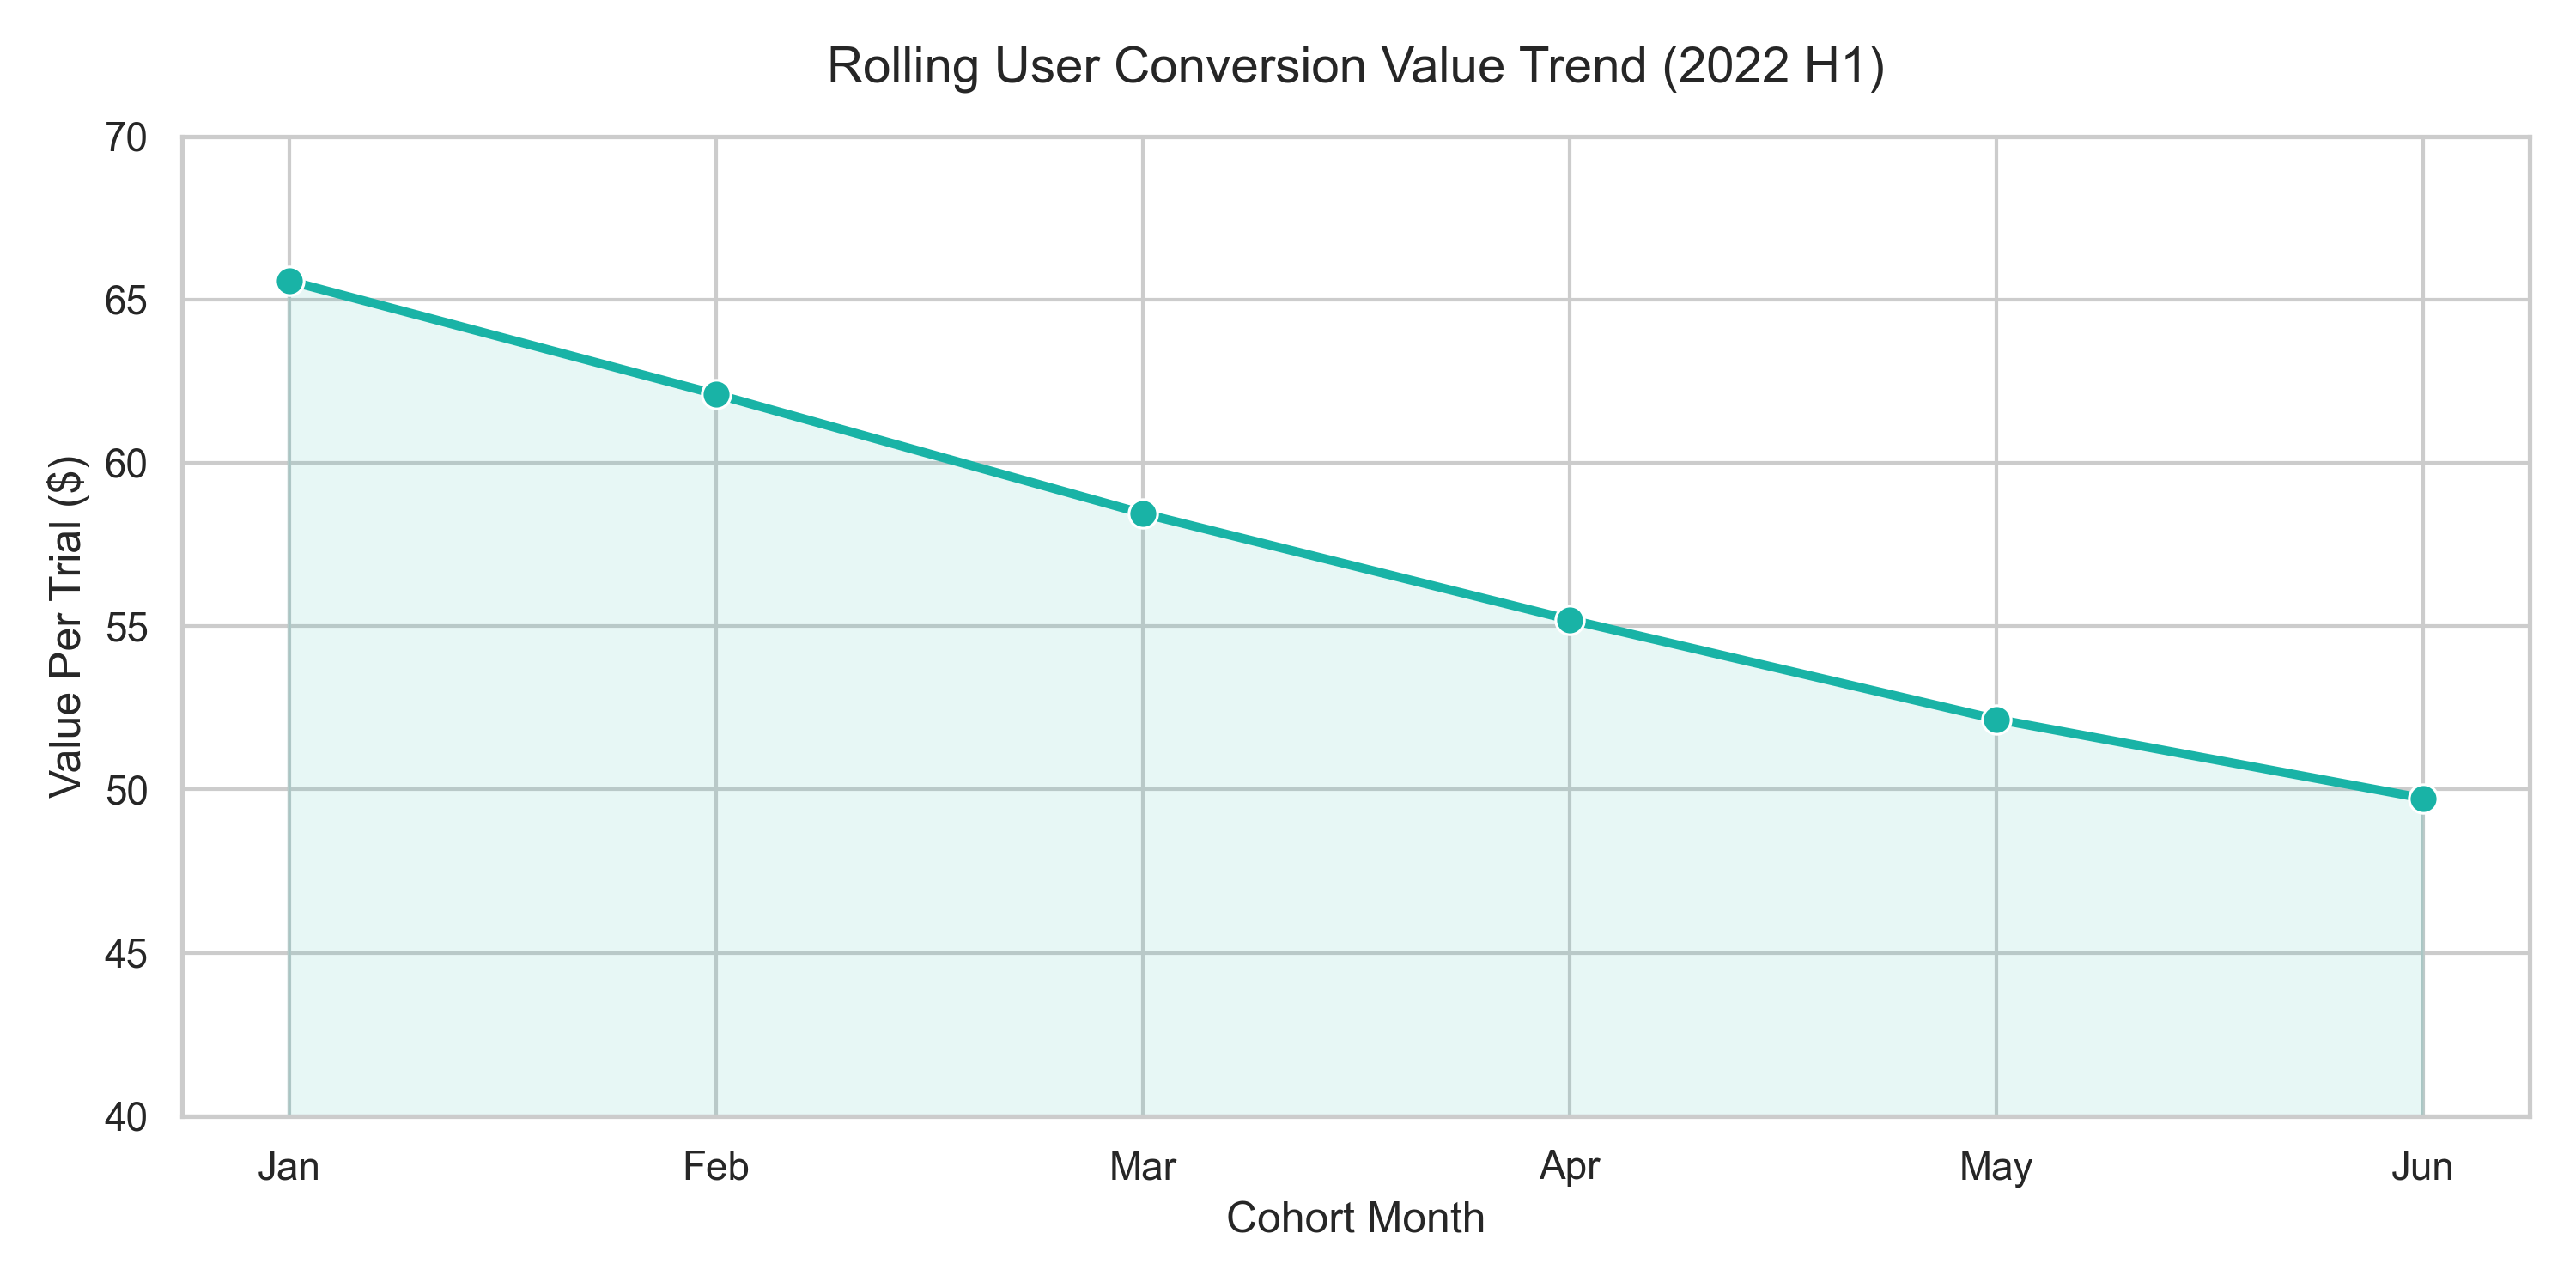
Looking at the cohort heatmap (coh.png mapping) and rolling conversion averages over 7 and 28-day periods, a distinct trend emerged over 2022. While January started exceptionally strong (32.08% conversion yielding $281,200), cohort value steadily declined throughout the first half of the year, bottoming at $49.73 per trial by June.
3. The “30-Day Wall” (Time to Purchase)
A key insight required by the product team was understanding exactly when users decide to buy.
Observation: We discovered an extreme structural “wall”. The Median (P50) conversion time is exactly 30 days. The 90th percentile (P90) is 31 days. Conclusion: Conversion is strictly tied to the trial expiration software limit rather than spontaneous mid-month value realization. Users don’t generally upgrade early; they wait until the system forces a decision.
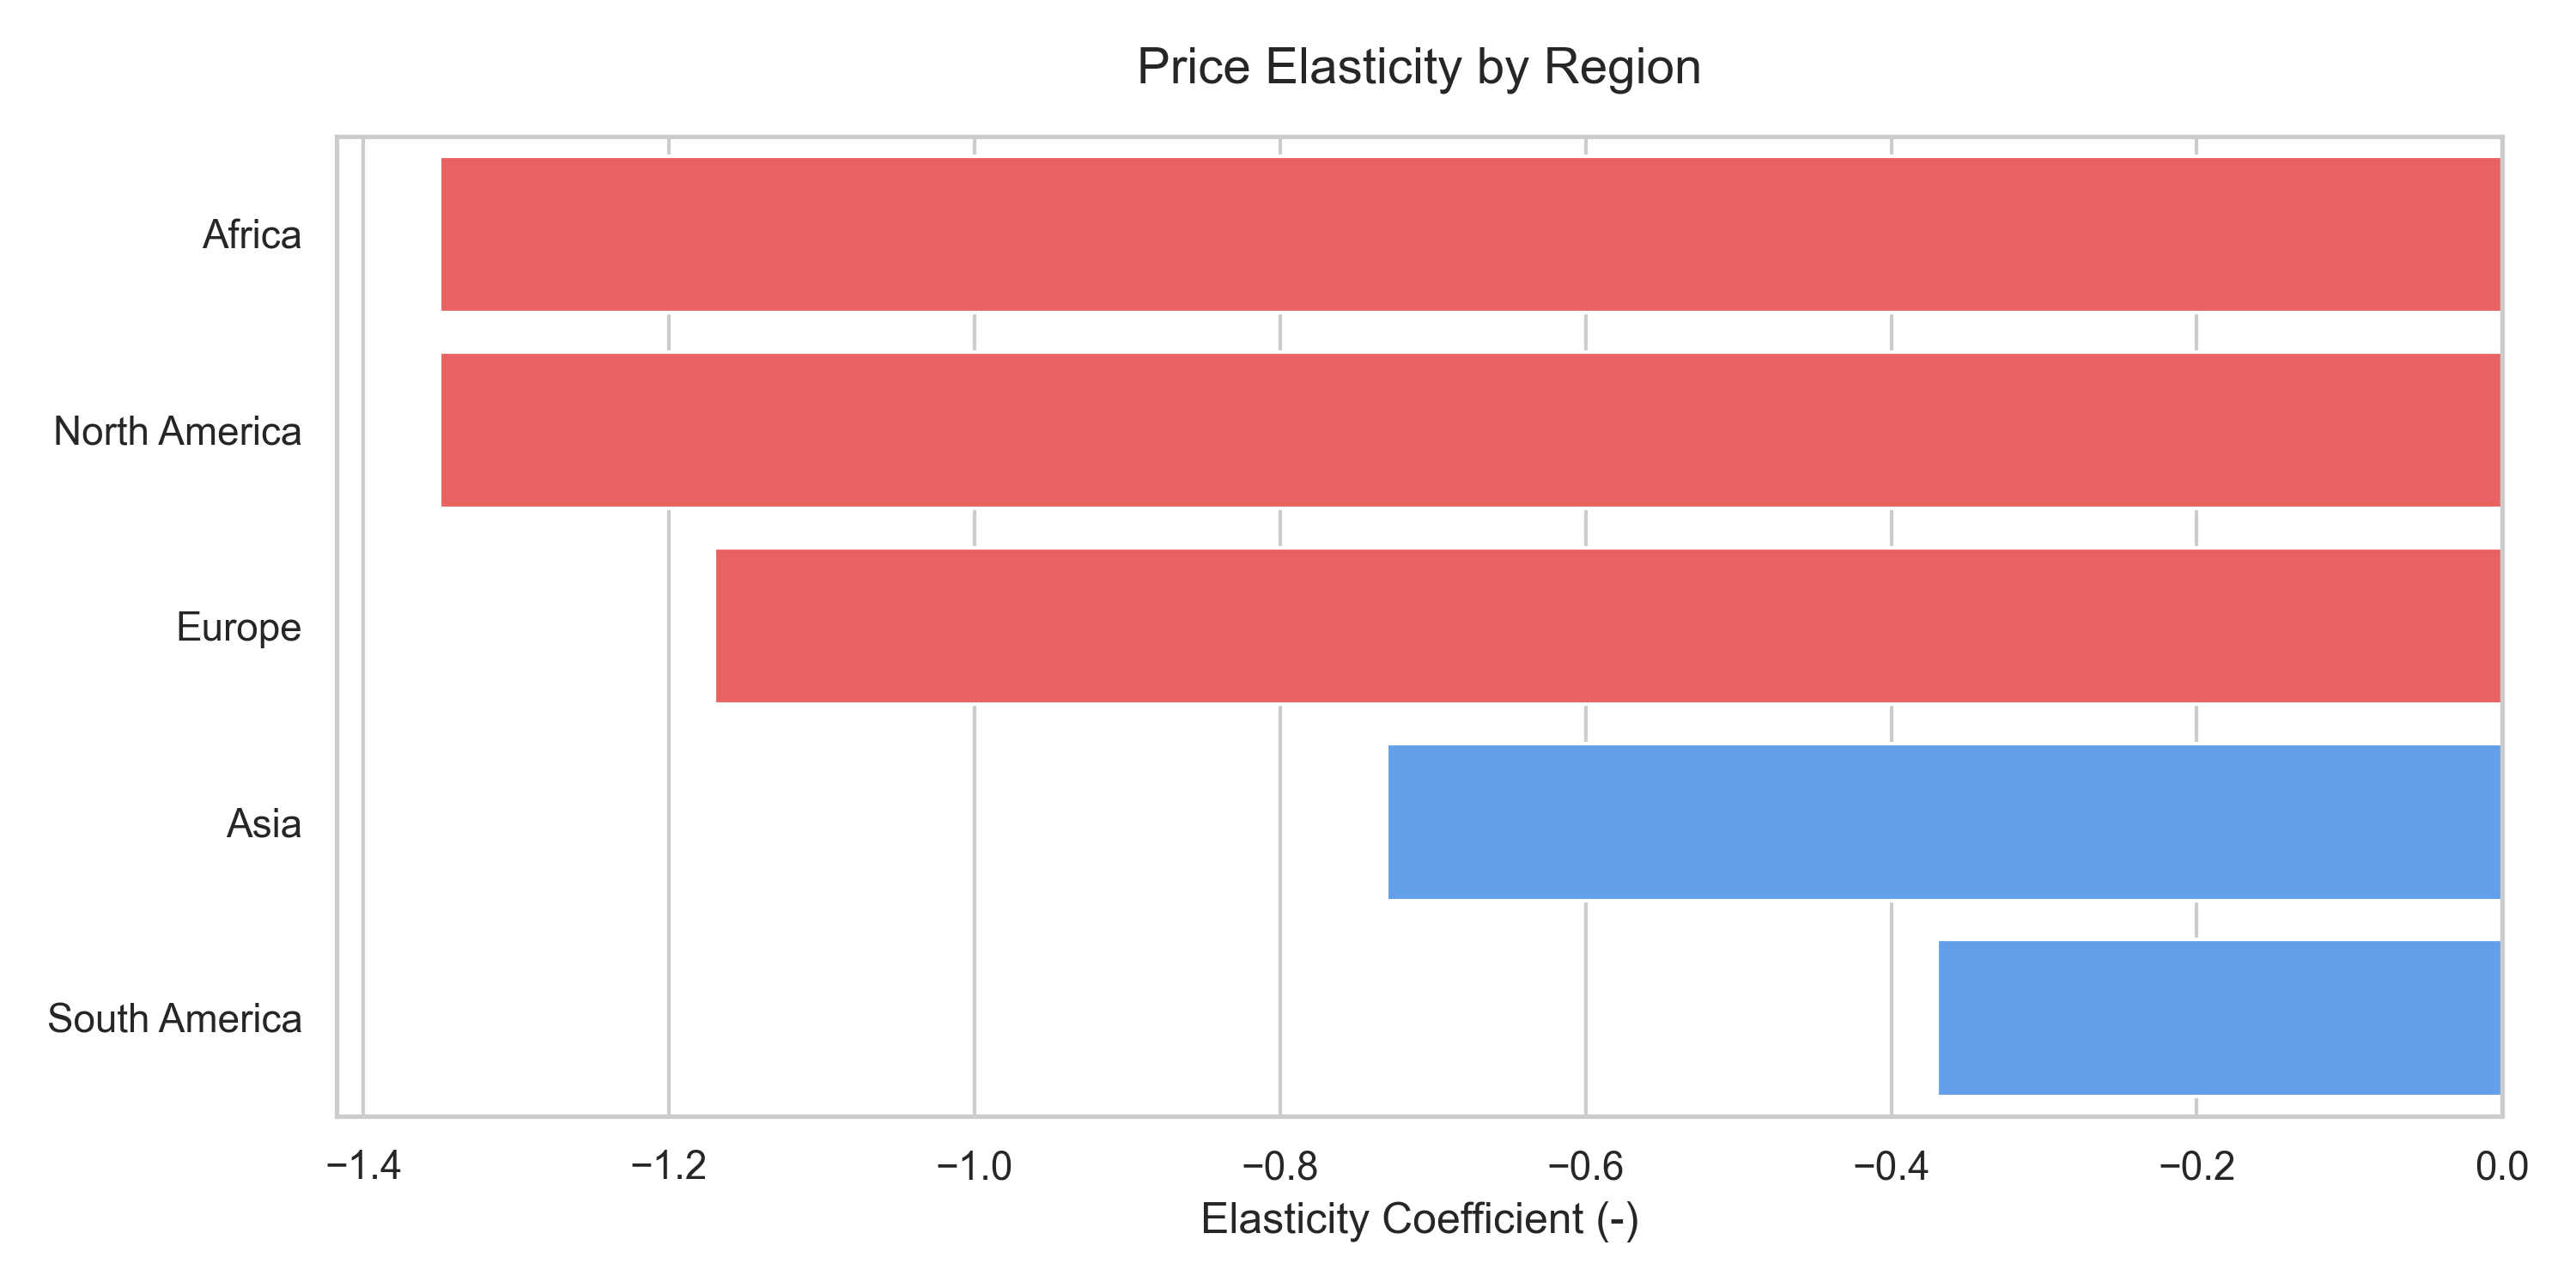
4. Measuring Price Elasticity Globally
To understand how pricing affects conversion rates globally, we measured price elasticity across the 6 tracked regions using advanced statistical tracking within SQL.
SELECT
    region,
    -- Utilizing regr_slope to calculate elasticity
    REGR_SLOPE(LN(conversion_rate), LN(subscription_price)) AS price_elasticity
FROM regional_subscription_data
GROUP BY region
ORDER BY price_elasticity ASC;
Conclusive Data on Elasticity: - Highly Sensitive: Africa (-1.35) and North America (-1.35). A 1% price increase here triggers an outsized drop in conversions. - Resilient (Inelastic): South America (-0.37) and Asia (-0.73).
Business Insight: Because South America shows both the highest Average Revenue Per User ($1.64 ARPU / $28.14 per trial) and the strongest inelasticity (-0.37), it represents the most lucrative market for targeted price elasticity optimizations and marketing scale-ups.
5. The Final Calculation: Free Trial Value
The ultimate metric that ties this project together is the Free Trial Value (cohort_value_per_free_trial). By knowing this number, acquisition teams know exactly what their ceiling is for Customer Acquisition Cost (CAC) without operating at a loss.
If the January trial was worth $65.57, marketing knows they could safely spend up to $65 to acquire that trial.
WITH cohort_totals AS (
    SELECT
        DATE_TRUNC('month', t.start_date) AS trial_month,
        COUNT(DISTINCT t.trial_id) AS total_trials,
        SUM(COALESCE(p.purchase_value, 0)) AS cohort_revenue
    FROM trials t
    LEFT JOIN purchases p
        ON t.trial_id = p.trial_id
        -- Ensuring we only count revenue strictly resulting from this trial
    GROUP BY trial_month
)
SELECT
    trial_month,
    total_trials,
    cohort_revenue,
    ROUND((cohort_revenue / total_trials), 2) AS value_per_trial
FROM cohort_totals
ORDER BY trial_month;
Conclusion
By establishing exactly what a trial is worth and mapping when users convert, this portfolio of queries directly ties web interaction data to the fundamental financial health of the business. Supplying leadership with actionable metrics like regional Price Elasticity directly dictates global pricing strategy, proving the tangible value of advanced SQL database modeling.